 Output Output
Output of the points in the difference file. Only points having difference will be shown.
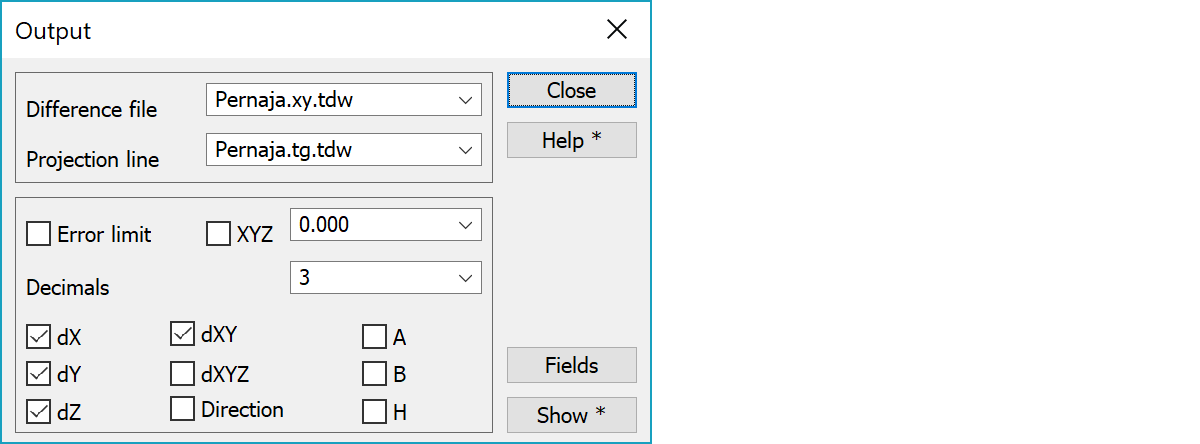
Select a difference file from the list. All vector files from file element list having differences are shown in the list.
Projection line is given if you want to have section number and/or offset in the output file. This can be a TG-file (road geometry), ML-file or a normal vector file (the first line in the file will be used).
If the checkbox is selected, only points having difference bigger than given value are shown in the output file. Otherwise all points are listed in the output file and points with bigger difference are marked with the asterisk at the end of the line. The XYZ checkbox determines if the XYZ or XY difference is used for checking. You can also give two comma separated values, who define lower and upper tolerance limit separately.
Amount of decimals in output.
You can select, which values to show in the output file. Columns dX,dY and dZ are always shown, but the value will be asterisk (*), if you haven’t selected it. dXYZ value shall have only components, which are calculated and selected for output. Dir is horizontal error (dXY) direction in gons.
Selection of code fields (T1-T6) and coordinates can be done in Calculation/Calculation results/Settings.
You can select also section number (A), offset (B) and height difference (H) according to road geometry. RG-file can be selected from the list.
Result file code field settings.
The result is written to a text file and shown using an editor. You can define a header file for the result file.
With Alt-key uses template defined in special setting.
Example of output file :
Control measurement   29.3.2011 16:46
  Dxyz: C:\Users\Mikko\Data\special\control2.xyz

      T4           X           Y     dA/dX     dB/dY        dZ       dXY      dXYZ
    3275 6697109.134 3444174.268  -0.05300  -0.01600  -0.06200   0.05536  -0.08312
    3276 6697111.657 3444186.348  -0.02100  -0.03700  +0.10300   0.04254  +0.11144
    3277 6697116.865 3444185.327  -0.01900  +0.01400  +0.10800   0.02360  +0.11055
    3278 6697116.243 3444182.058  +0.02600  -0.01500  +0.06600   0.03002  +0.07251
    3279 6697118.874 3444182.144  +0.21300  +0.57400  +0.06400   0.61225  +0.61558
    3280 6697117.774 3444177.373  -0.00800  +0.07200  +0.03500   0.07244  +0.08045
    3281 6697120.658 3444176.792  +0.04100  +0.07400  +0.00300   0.08460  +0.08465
    3282 6697119.637 3444172.174  -0.03500  +0.04800  +0.00500   0.05941  +0.05962

                     Min     N=8  -0.05300  -0.03700  -0.06200   0.02360  -0.08312
                     Max     N=8  +0.21300  +0.57400  +0.10800   0.61225  +0.61558
                     MinAbs  N=8   0.00800   0.01400   0.00300   0.02360   0.05962
                     MaxAbs  N=8   0.21300   0.57400   0.10800   0.61225   0.61558
                     Mean    N=8  +0.01800  +0.08925  +0.04025   0.12253  +0.13146
                     MeanAbs N=8   0.05200   0.10625   0.05575   0.12253   0.15224
                     StdDev  N=8   0.08454   0.20027   0.05716   0.19893   0.18935
Any undefined value (not calculated) is shown by asterisk (*). Use code field T5 to define (already when measuring the point) which coordinates can be used for calculation.
Statistics shown:
There are some special settings related to this function.
Field width in the result file.
Default values for the number of decimals in selection list.
Default values for the limit values in selection list.
Field width of differences in output file.
Header file copied to the beginning of the output file.
Template file for modifying output format.
See also: Using special settings