 Profile comparison settings Profile comparison settings
Settings connected to comparing profiles.
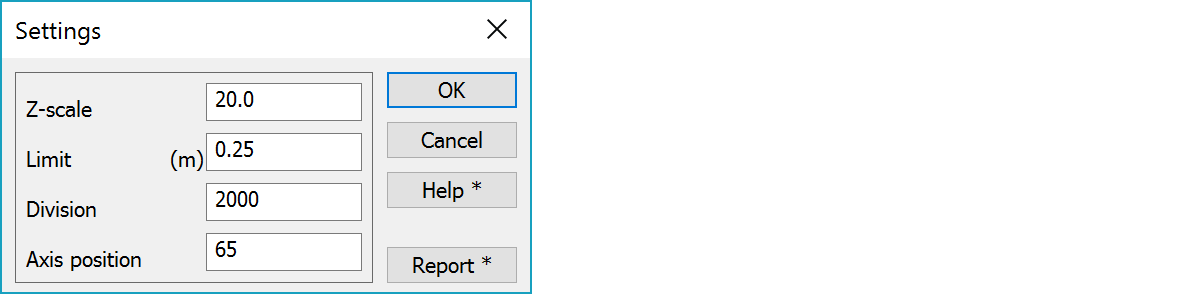
Scale factor used when drawing a distinction diagram.
An allowable difference limit can be set. The function calculates the difference between the two profiles (over the limit) and gives a percentage difference.
Determines how many parts the profile is divided for calculation.
Vertical position of horizontal axis.
Opens resultfile having results for every calculated line:
- percantage over given limit values. Limit values are 0.10 (fixed) and user defined limit value.
- Min = minimum difference
- Max = maximum difference
- Mean = mean value
- MeanAbs = mean value of absolute values
- MeanSqr = quadratic mean value
- MeanDev = mean deviation
- StdDev = standard deviation
Use Shift-Report to reset the result file.
Use Alt-Report to calculate all lines in active file.
There are some special settings related to this function.
Displayed information.
1 mean
2 mean sqr
4 min, max
8 limit
16 pos
32 count
64 dev
See also: Using special settings